A few good looking recursive functions
Jon Maiga, 2019-06-11
Every now and then I run into functions that makes me go “wow this looks different”!
In this post I will list a few simple recursive formulas that yield somewhat surprising graphs. I will settle with noting they look nice and leave further analysis to the reader.
1 - the braid
Let’s start with a simple
With the initial values of we get
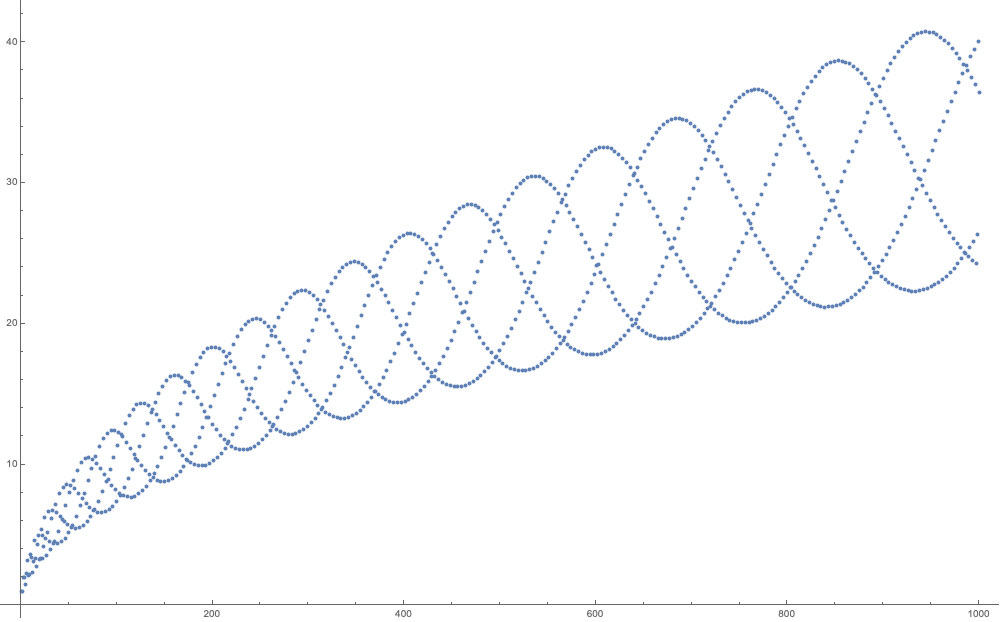
The simple recursive function (1) creates a braid that seems to follow . What are the upper and lower bounds?
Now if we take the first differences of (1) we get it centered around the x-axis
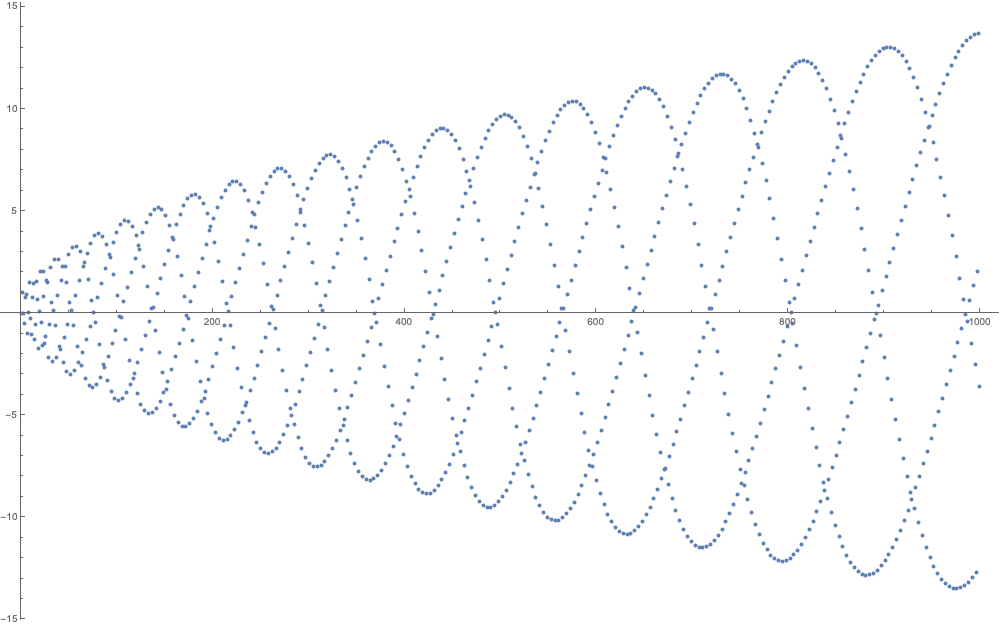
- What are the upper/lower bounds?
- What is the period? (if you can call it that)
2 - the weirdo
Changing the initial values of (1) dramatically changes the function, for example
gives us
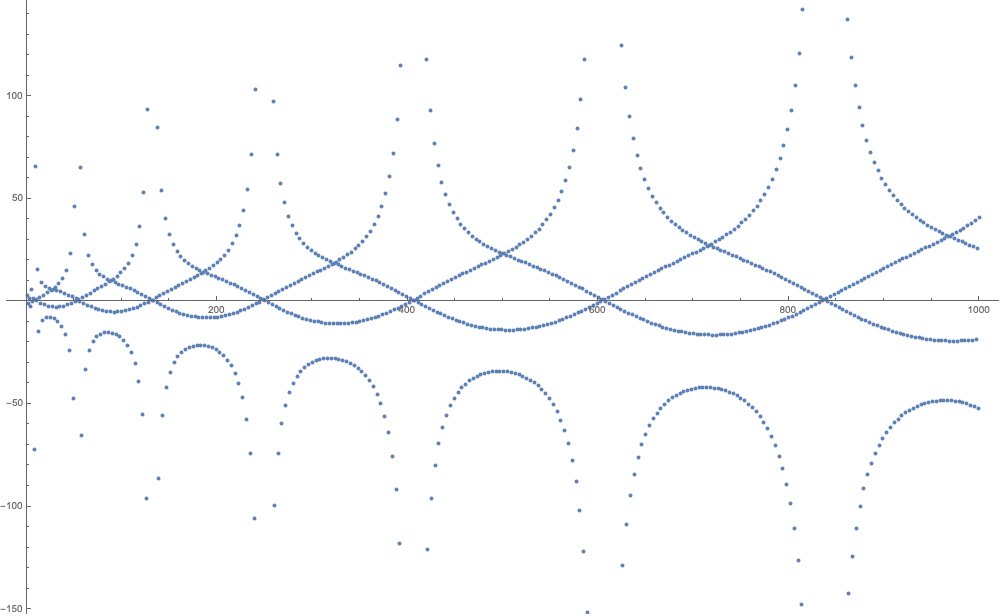
Note that this graph has some extreme values that have been omitted. Taking the first differences gives us
- Is there anything interesting going on where it seems to cross the x-axis?
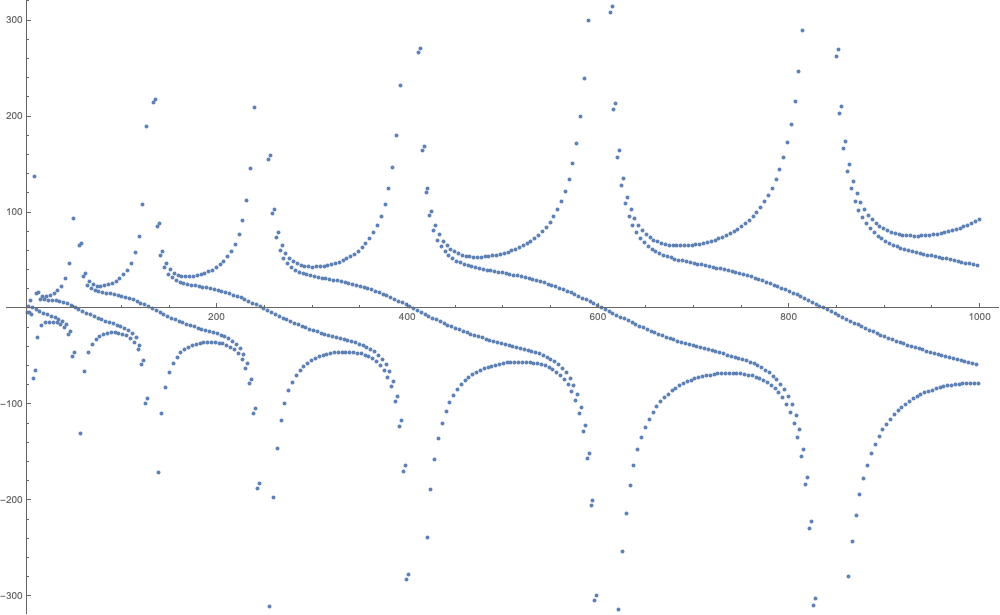
3 - the Enterprise
Another remarkable plot is
With and we get
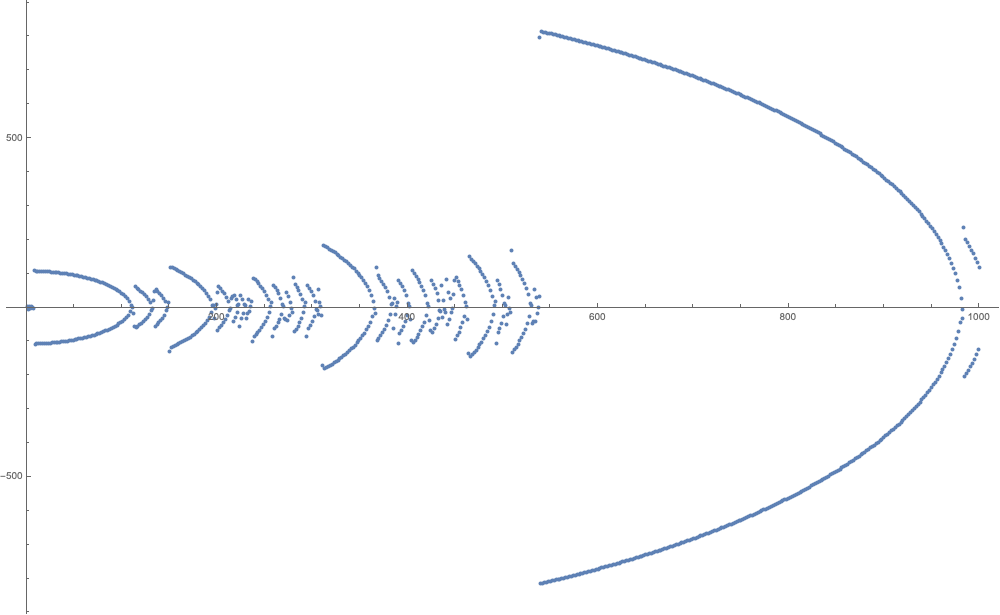
- Is there anything interesting about this one?
4 - ten curves in one
Another noteworthy is
With we get
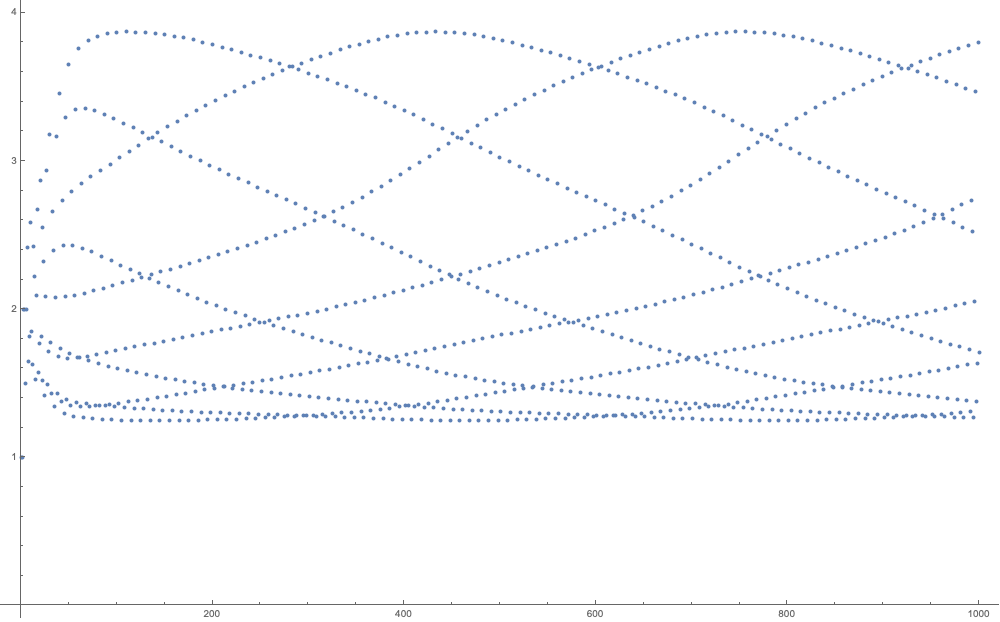
- Why is it split into ten different curves?
5 - heaps of primes
Finally, let’s look at one involving the primes
With and we have
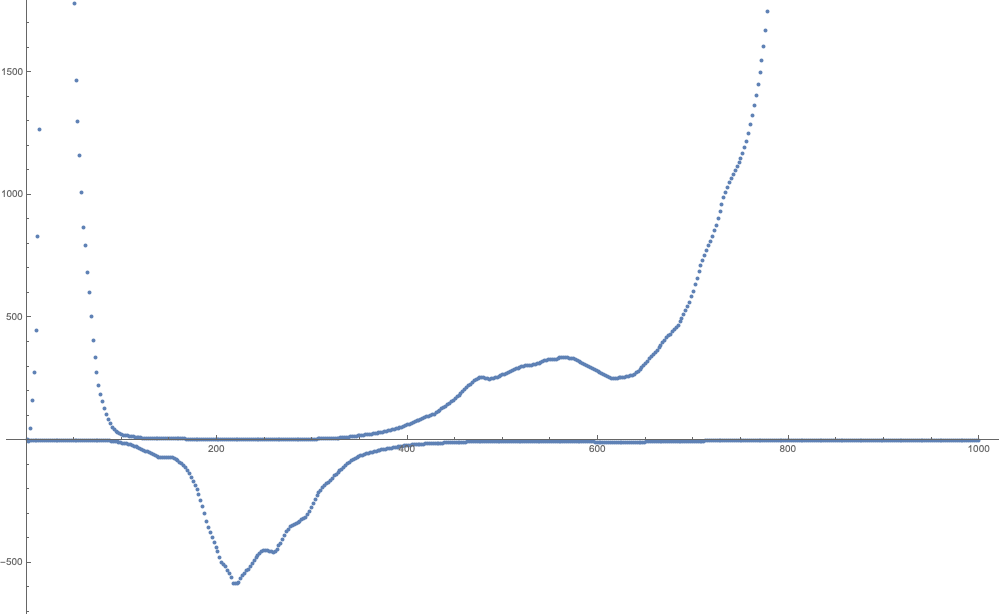
- What is this?
Conclusion
My gut feeling is that those are more the kind of function you look at than get anything sensible out of. Although I would be grateful for any feedback on those. I don’t even know (and haven’t looked much) if they have been studied?
All sequences was found while I was browsing sequencedb.net, a machine generated database with decimal and integer sequences.
Written with StackEdit.